Introduction
Nagios supports optional detection of hosts and services that are "flapping". Flapping occurs when a service or host changes state too frequently, resulting in a storm of problem and recovery notifications. Flapping can be indicative of configuration problems (i.e. thresholds set too low) or real network problems.
Before I go any futher, let me say that flapping detection has been a little difficult to implement. How exactly does one determine what "too frequently" means in regards to state changes for a particular host or service? When I first started looking into flap detection I tried to find some information on how flapping could/should be detected. After I couldn't find any, I decided to settle with what seemed to be a reasonable solution. The methods by which Nagios detects service and host state flapping are described below...
Service Flap Detection
Whenever a service check is performed that results in a hard state or a soft recovery state, Nagios checks to see if the services has started or stopped flapping. It does this by storing the results of the last 21 checks of the service in an array. Older check results in the array are overwritten by newer check results.
The contents of the historical state array are examined (in order from oldest result to newest result) to determine the total percentage of change in state that has occurred during the last 21 service checks. A state change occurs when an archived state is different from the archived state that immediately precedes it in the array. Since we keep the results of the last 21 service checks in the array, there is a possibility of having 20 state changes.
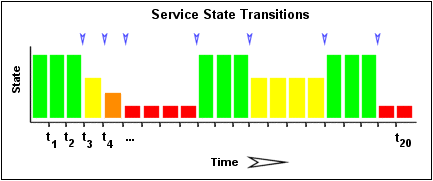
Image 1 below shows a chronological array of service states. OK states are shown in green, WARNING states in yellow, CRITICAL states in red, and UNKNOWN states in orange. Blue arrows have been placed over periods of time where state changes occur.
| Image 1. |
|
|
Services that rarely change between states will have a lower total percentage of change than those that do change between states a lot. Since flapping is associated with frequent state changes, we can use the calculated amount of change in state over a period of time (in this case, the last 21 service checks) to determine whether or not a service is flapping. That's not quite good enough though...
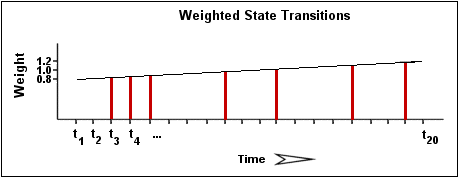
It stands to reason that newer state changes should carry more weight than older state changes, so we really need to recalculate the total percent change in state for the service on some sort of curve... To make things simple, I've decided to make the relationship between time and weight linear for calculation of percent state change. The flap detection routines are currently designed to make the newest possible state change carry 50% more weight than the oldest possible state change. Image 2 shows how more recent state changes are given more weight than older state changes when calculating the overall or total percent state change for a particular service. If you really want to see exactly how the weighted calculation is done, look at the code in base/flapping.c...
| Image 2. |
|
Let's look at a quick example of how flap detection is done. Image 1 above depicts the array of historical service check results for a particular service. The oldest result is on the left and the newest result is on the right. We see that in the example below there were a total of 7 state changes (at t3, t4, t5, t9, t12, t16, and t19). Without any weighting of the state changes over time, this would give us a total state change of 35% (7 state changes out of a possible 20 state changes). When the individual state changes are weighted relative to the time at which they occurred, the resulting total percent state change for the service is less than 35%. This makes sense since most of the state changes occurred earlier rather than later. Let's just say that the weighted percent of state change turned out to be 31%...
So what significance does the 31% state change have? Well, if the service was previously not flapping and 31% is equal to or greater than the value specified by the high_service_flap_threshold option in the service definition, Nagios considers the service to have just started flapping. If the service was previously flapping and 31% is less than or equal to the value specified by the low_service_flap_threshold value in the service definition, Nagios considers the service to have just stopped flapping. If either of those two conditions are not met, Nagios does nothing else with the service, since it is either not currently flapping or it is still flapping...
Host Flap Detection
Host flap detection works in a similiar manner to service flap detection, with one important difference: Nagios will attempt to check to see if a host is flapping whenever the status of the host is checked and whenever a service associated with that host is checked. Why is this done? Well, with services we know that the minimum amount of time between consecutive flap detection routines is going to be equal to the service check interval. With hosts, we don't have a check interval, since hosts are not monitored on a regular basis - they are only checked as necessary. A host will be checked for flapping if its state has changed since the last time the flap detection was performed for that host or if its state has not changed but at least x amount of time has passed since the flap detection was performed. The x amount of time is equal to the average check interval of all services associated with the host. That's the best method I could come up with for determining how often flap detection could be performed on a host...
Just as with services, Nagios stores the results of the last 21 of these host checks in an array for the flap detection logic. State changes are weighted based on the time at which they occurred, and the total percent change in state is calculated in the same manner that it is in the service flapping logic.
If a host was previously not flapping and its total computed state change percentage is equal to or greater than the value specified by the high_host_flap_threshold option, Nagios considers the host to have just started flapping. If the host was previously flapping and its total computed state change percentage is less than or equal to the value specified by the low_host_flap_threshold value, Nagios considers the host to have just stopped flapping. If either of those two conditions are not met, Nagios does nothing else with the host, since it is either not currently flapping or it is still flapping...
Host- and Service-Specific Flap Detection Thresholds
If you're using the template-based object definition files, you can specify host- and service-specific flap detection thresholds by adding low_flap_threshold and high_flap_threshold directives to individual host and service definitions. If these directives are not present in the host or service definitions, the global host and service flap detection thresholds will be used.
On a similiar note, you can also enable/disable flap detection for specific hosts and services by using the enable_flap_detection directive in each object definition. Note that flap detection must be enabled on a program-wide basis (using the enable_flap_detection directive in the main config file) in order for any host or service to have flap detection enabled.
Flap Handling
When a service or host is first detected as flapping, Nagios will do three things:
When a service or host stops flapping, Nagios will do the following: