Introduction
A utility called nagiostats is included in the Nagios distribution. It is compiled and installed along with the main Nagios daemon.
The nagiostats utility allows you to obtain various information about a running Nagios process. You can obtain information either in human-readable or MRTG-compatible format.
Usage Information
You can run the nagiostats utility with the --help option to get usage information:
[nagios@lanman ~]# /usr/local/nagios/bin/nagiostats --help

Nagios Stats 2.0a1
Copyright (c) 2003 Ethan Galstad (nagios@nagios.org)
Last Modified: 11-18-2003
License: GPL

Usage: /usr/local/nagios/bin/nagiostats [options]

Startup:
 -V, --version      display program version information and exit.
 -L, --license      display license information and exit.
 -h, --help         display usage information and exit.

Input file:
 -c, --config=FILE  specifies location of main Nagios config file.

Output:
 -m, --mrtg         display output in MRTG compatible format.
 -d, --data=VARS    comma-seperated list of variables to output in MRTG
                    (or compatible) format.  See possible values below.
                    Percentages are rounded, times are in milliseconds.

MRTG DATA VARIABLES (-d option):
 NUMSERVICES        total number of services.
 NUMHOSTS           total number of services.
 NUMSVCOK           number of services OK.
 NUMSVCWARN         number of services WARNING.
 NUMSVCUNKN         number of services UNKNOWN.
 NUMSVCCRIT         number of services CRITICAL.
 NUMSVCPROB         number of service problems (WARNING, UNKNOWN or CRITIAL).
 NUMHSTUP           number of hosts UP.
 NUMHSTDOWN         number of hosts DOWN.
 NUMHSTUNR          number of hosts UNREACHABLE.
 NUMHSTPROB         number of host problems (DOWN or UNREACHABLE).
 xxxACTSVCLAT       MIN/MAX/AVG active service check latency (ms).
 xxxACTSVCEXT       MIN/MAX/AVG active service check execution time (ms).
 xxxACTSVCPSC       MIN/MAX/AVG active service check % state change.
 xxxPSVSVCPSC       MIN/MAX/AVG passive service check % state change.
 xxxSVCPSC          MIN/MAX/AVG service check % state change.
 xxxACTHSTLAT       MIN/MAX/AVG active host check latency (ms).
 xxxACTHSTEXT       MIN/MAX/AVG active host check execution time (ms).
 xxxACTHSTPSC       MIN/MAX/AVG active host check % state change.
 xxxPSVHSTPSC       MIN/MAX/AVG passive host check % state change.
 xxxHSTPSC          MIN/MAX/AVG host check % state change.
 NUMACTHSTCHKxM    number of active host checks in last 1/5/15/60 minutes.
 NUMPSVHSTCHKxM    number of passive host checks in last 1/5/15/60 minutes.
 NUMACTSVCCHKxM    number of active service checks in last 1/5/15/60 minutes.
 NUMPSVSVCCHKxM    number of passive service checks in last 1/5/15/60 minutes.

 Note: Replace x's in MRTG variable names with 'MIN', 'MAX', 'AVG', or the
       the appropriate number (i.e. '1', '5', '15', or '60').

[nagios@lanman ~]#
Human-Readable Output
For normal operation, run the nagiostats utility, specifying only the config file location as an argument, as follows:
[nagios@lanman ~]# /usr/local/nagios/bin/nagiostats -c /usr/local/nagios/etc/nagios.cfg

Nagios Stats 2.0a1
Copyright (c) 2003 Ethan Galstad (nagios@nagios.org)
Last Modified: 11-18-2003
License: GPL

CURRENT STATUS DATA
----------------------------------------------------
Status File:                          /usr/local/nagios/var/status.dat
Status File Age:                      0d 0h 0m 13s
Status File Version:                  2.0-very-pre-alpha

Program Running Time:                 14d 17h 19m 13s

Total Services:                       32
Services Checked:                     32
Services Scheduled:                   29
Active Service Checks:                29
Passive Service Checks:               3
Total Service State Change:           0.000 / 65.530 / 2.930 %
Active Service Latency:               0.048 / 14.837 / 1.035 %
Active Service Execution Time:        0.076 / 60.006 / 4.301 sec
Active Service State Change:          0.000 / 10.530 / 0.762 %
Active Services Last 1/5/15/60 min:   1 / 13 / 29 / 29
Passive Service State Change:         0.000 / 65.530 / 23.883 %
Passive Services Last 1/5/15/60 min:  0 / 0 / 0 / 0
Services Ok/Warn/Unk/Crit:            23 / 5 / 1 / 3
Services Flapping:                    1
Services In Downtime:                 0

Total Hosts:                          9
Hosts Checked:                        9
Hosts Scheduled:                      9
Active Host Checks:                   9
Passive Host Checks:                  0
Total Host State Change:              0.000 / 28.420 / 4.034 %
Active Host Latency:                  0.000 / 15.741 / 5.443 %
Active Host Execution Time:           1.022 / 10.032 / 3.047 sec
Active Host State Change:             0.000 / 28.420 / 4.034 %
Active Hosts Last 1/5/15/60 min:      0 / 8 / 9 / 9
Passive Host State Change:            0.000 / 0.000 / 0.000 %
Passive Hosts Last 1/5/15/60 min:     0 / 0 / 0 / 0
Hosts Up/Down/Unreach:                7 / 1 / 1
Hosts Flapping:                       0
Hosts In Downtime:                    0


[nagios@lanman ~]#
As you can see, the utility displays a number of different metrics pertaining to the Nagios process. Metrics which have multiple values are (unless otherwise specified) min, max and average values for that partciular metric.
MRTG Integration
You can use the nagiostats utility to display various Nagios metrics using MRTG (or other compatible program). To do so, run the nagiostats utility using the --mrtg and --data arguments. The --data argument is used to specify what statistics should be graphed. Possible values for the --data argument can be found by running the nagiostats utility with the --help option.
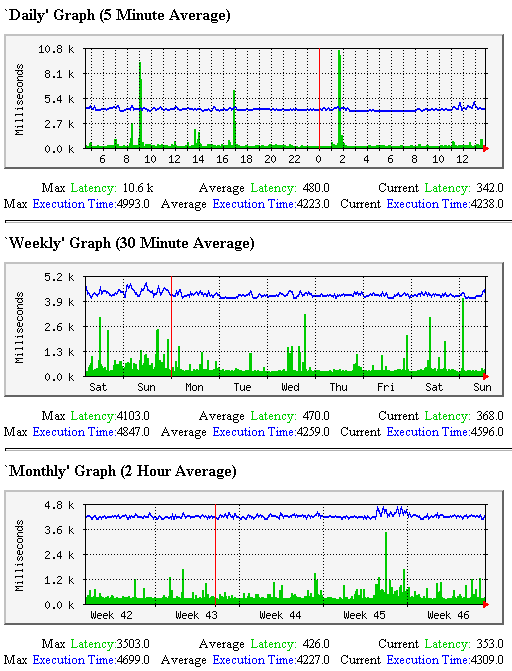
Here's an MRTG config file snippet for using the nagiostats utility for graphing average service latency and execution time.
# Service Latency and Execution Time Target[nagios-a]: `/usr/local/nagios/bin/nagiostats --mrtg --data=AVGACTSVCLAT,AVGACTSVCEXT` MaxBytes[nagios-a]: 100000 Title[nagios-a]: Average Service Check Latency and Execution Time PageTop[nagios-a]: <H1>Average Service Check Latency and Execution Time</H1> Options[nagios-a]: growright,gauge,nopercent YLegend[nagios-a]: Milliseconds ShortLegend[nagios-a]: LegendI[nagios-a]: Latency: LegendO[nagios-a]: Execution Time: Legend1[nagios-a]: Latency Legend2[nagios-a]: Execution Time Legend3[nagios-a]: Maximal 5 Minute Latency Legend4[nagios-a]: Maximal 5 Minute Execution Time
The MRTG graphs generated from the above config snippet look like this: