Introduction
On of the features of Nagios is that is can process host and service check results that are submitted by external applications. Host and service checks which are performed and submitted to Nagios by external apps are called passive checks. Passive checks can be contrasted with active checks, which are host or service checks that have been initiated by Nagios.
Why The Need For Passive Checks?
Passive checks are useful for monitoring services that are:
Passive host and service checks are also useful when configured a distributed monitoring setup.
Passive Service Checks vs. Passive Host Checks
Passive host and service checks function in a similiar manner, but there are some important limitations in regards to passive host checks. Read below for more information about the limitations with passive host checks.
How Do Passive Service Checks Work?
The only real difference between active and passive checks is that active checks are initiated by Nagios, while passive checks are performed by external applications. Once an external application has performed a service check (either actively or by having received an synchronous event like an SNMP trap or security alert), it submits the results of the service "check" to Nagios through the external command file.
The next time Nagios processes the contents of the external command file, it will place the results of all passive service checks into a queue for later processing. The same queue that is used for storing results from active checks is also used to store the results from passive checks.
Nagios will periodically execute a service reaper event and scan the service check result queue. Each service check result, regardless of whether the check was active or passive, is processed in the same manner. The service check logic is exactly the same for both types of checks. This provides a seamless method for handling both active and passive service check results.
How Do External Apps Submit Service Check Results?
External applications can submit service check results to Nagios by writing a PROCESS_SERVICE_CHECK_RESULT external command to the external command file.
The format of the command is as follows:
[<timestamp>] PROCESS_SERVICE_CHECK_RESULT;<host_name>;<description>;<return_code>;<plugin_output>
where...
Note that in order to submit service checks to Nagios, a service must have already been defined in the object configuration file! Nagios will ignore all check results for services that had not been configured before it was last (re)started.
If you only want passive results to be provided for a specific service (i.e. active checks should not be performed), simply set the active_checks_enabled member of the service definition to 0. This will prevent Nagios from ever actively performing a check of the service. Make sure that the passive_checks_enabled member of the service definition is set to 1. If it isn't, Nagios won't process passive checks for the service!
An example shell script of how to submit passive service check results to Nagios can be found in the documentation on volatile services.
Submitting Passive Service Check Results From Remote Hosts
If an application that resides on the same host as Nagios is sending passive service check results, it can simply write the results directly to the external command file as outlined above. However, applications on remote hosts can't do this so easily. In order to allow remote hosts to send passive service check results to the host that runs Nagios, I've developed the nsca addon. The addon consists of a daemon that runs on the Nagios hosts and a client that is executed from remote hosts. The daemon will listen for connections from remote clients, perform some basic validation on the results being submitted, and then write the check results directly into the external command file (as described above). More information on the nsca addon can be found here...
Using Both Active And Passive Service Checks
Unless you're implementing a distributed monitoring environment with the central server accepting only passive service checks (and not performing any active checks), you'll probably be using both types of checks in your setup. As mentioned before, active checks are more suited for services that lend themselves to periodic checks (availability of an FTP or web server, etc), whereas passive checks are better off at handling asynchronous events that occur at variable intervals (security alerts, etc.).
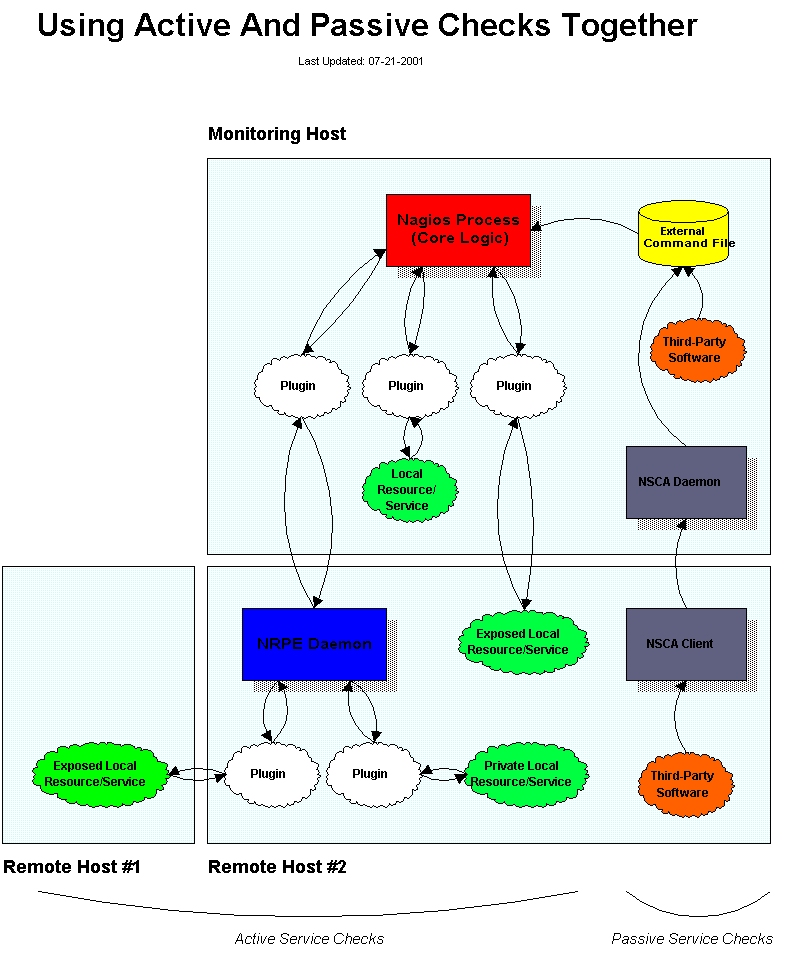
The image below gives a visual representation of how active and passive service checks can both be used to monitor network resources (click on the image for a larger version).
The orange bubbles on the right side of the image are third-party applications that submit passive check results to Nagios' external command file. One of the applications resides on the same host as Nagios, so it can write directly to the command file. The other application resides on a remote host and makes used of the nsca client program and daemon to transfer the passive check results to Nagios.
The items on the left side of the image represent active service checks that Nagios is performing. I've shown how the checks can be made for local resources (disk usage, etc.), "exposed" resources on remote hosts (web server, FTP server, etc.), and "private" resources on remote hosts (remote host disk usage, processor load, etc.). In this example, the private resources on the remote hosts are actually checked by making use of the nrpe addon, which facilitates the execution of plugins on remote hosts.
How Do Passive Host Checks Work?
Passive host checks work in a similiar manner to passive service checks. Once an external application has performed a host check, it submits the results of that host "check" to Nagios through the external command file. The next time Nagios processes the contents of the external command file, it will process the host check result that was submitted.
WARNING! Passive host checks have some limitations. Unlike active host checks, Nagios does not attempt to determine whether or host is DOWN or UNREACHABLE with passive checks. Rather, Nagios takes the passive check result to be the actual state the host is in and doesn't try to determine the actual state. In contrast, Nagios attempts to determine the proper status (DOWN or UNREACHABLE) for hosts that are not UP when the host check is active (initiated by Nagios). This can cause problems if you are submitting passive checks from a remote host or you have a distributed monitoring setup where the parent/child host relationships are different. See the documentation on host reachability for more information on how DOWN and UNREACHABLE states are determined for active host checks.
How Do External Apps Submit Host Check Results?
External applications can submit host check results to Nagios by writing a PROCESS_HOST_CHECK_RESULT external command to the external command file.
The format of the command is as follows:
[<timestamp>] PROCESS_HOST_CHECK_RESULT;<host_name>;<host_status>;<plugin_output>
where...
Note that in order to submit host checks to Nagios, a host must have already been defined in the object configuration file! Nagios will ignore all check results for hosts that had not been configured before it was last (re)started.
Submitting Passive Host Check Results From Remote Hosts
If an application that resides on the same host as Nagios is sending passive service check results, it can simply write the results directly to the external command file as outlined above. However, applications on remote hosts can't do this so easily. In order to allow remote hosts to send passive host check results to the host that runs Nagios, you can use the nsca addon. The addon consists of a daemon that runs on the Nagios hosts and a client that is executed from remote hosts. The daemon will listen for connections from remote clients, perform some basic validation on the results being submitted, and then write the check results directly into the external command file (as described above). More information on the nsca addon can be found here.